William T. Fitzpatrick, CFA
December 2023

Executive Summary:
- An extended period of low interest rates, combined with unprecedented advancements in technology, contributed to an extraordinary flow of assets into US equities.
- We believe the unwind has begun, as US and international stocks have fared comparably over the last year despite the first half surge in US technology stocks.
- While valuations remain supportive of international equities, this paper highlights the fundamental case for owning stocks today in international developed markets.
- We expect the median holding in Logan Capital’s International ADR (“Logan International”) strategy to generate 5.5% EPS growth over the next 12 months and grew its dividend by 6.3% in the last year.
- Despite favorable fundamental performance, as of September 30, 2023, the strategy traded at just 11x 2024 EPS estimates and offered a gross dividend yield of 4.5%.
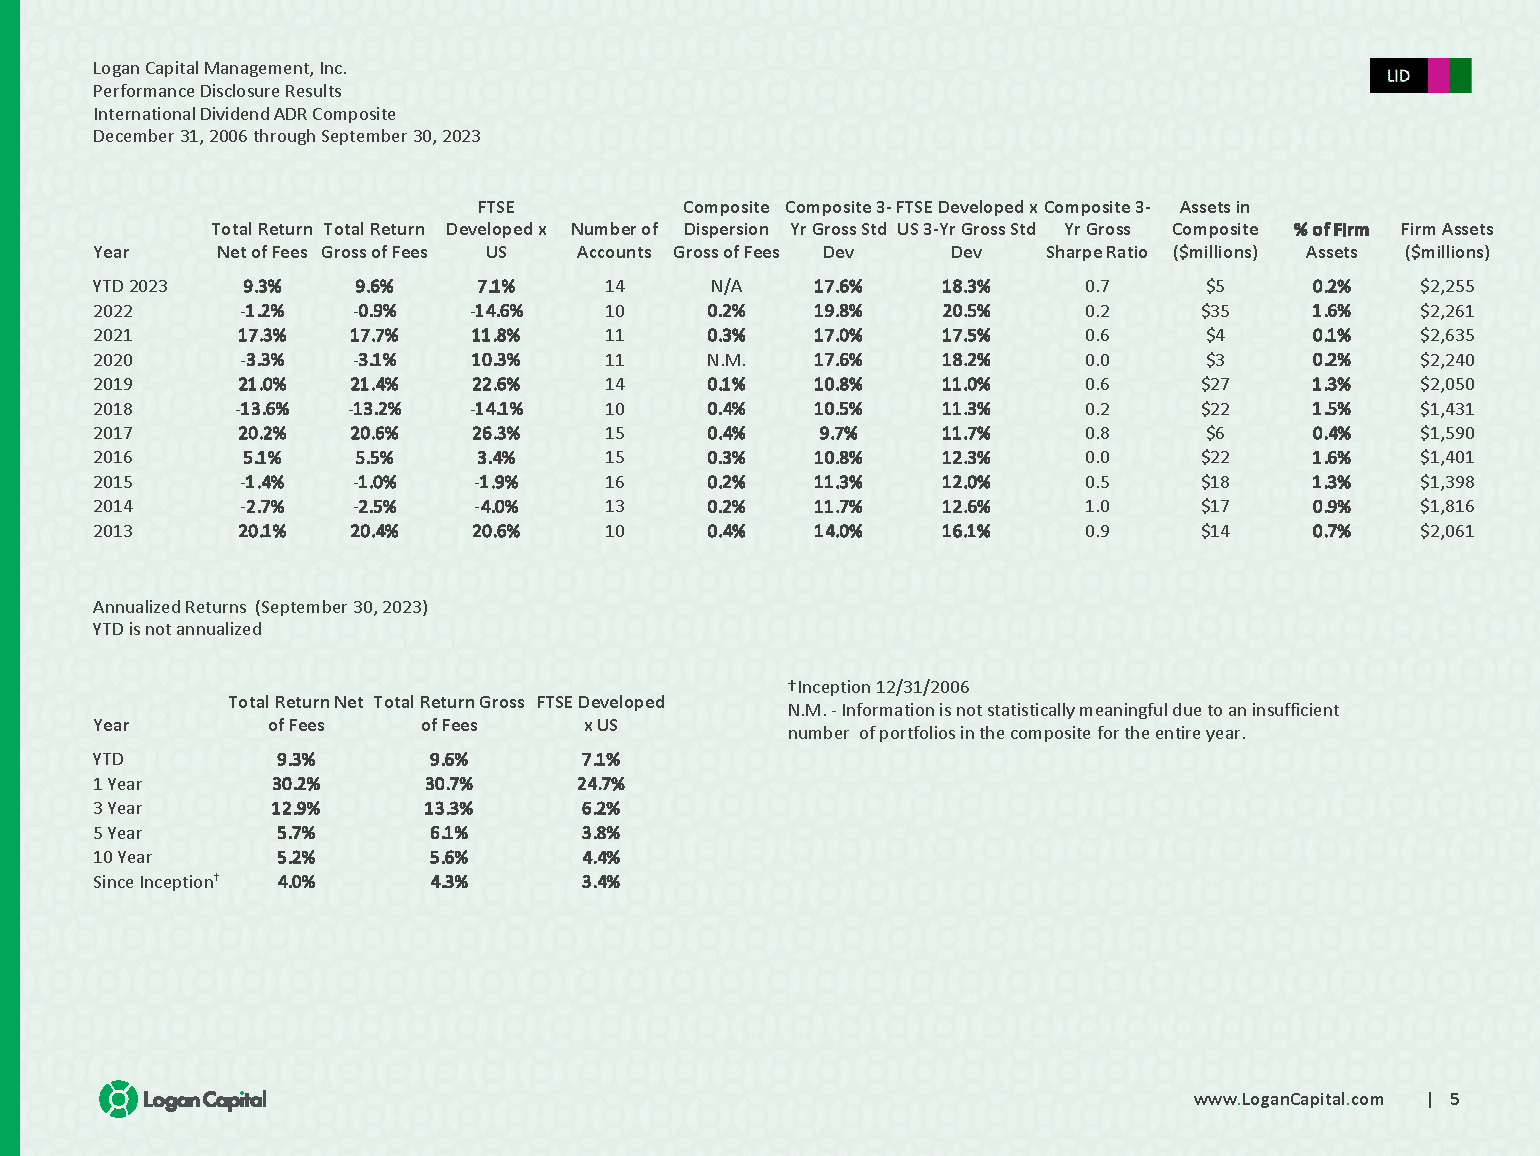
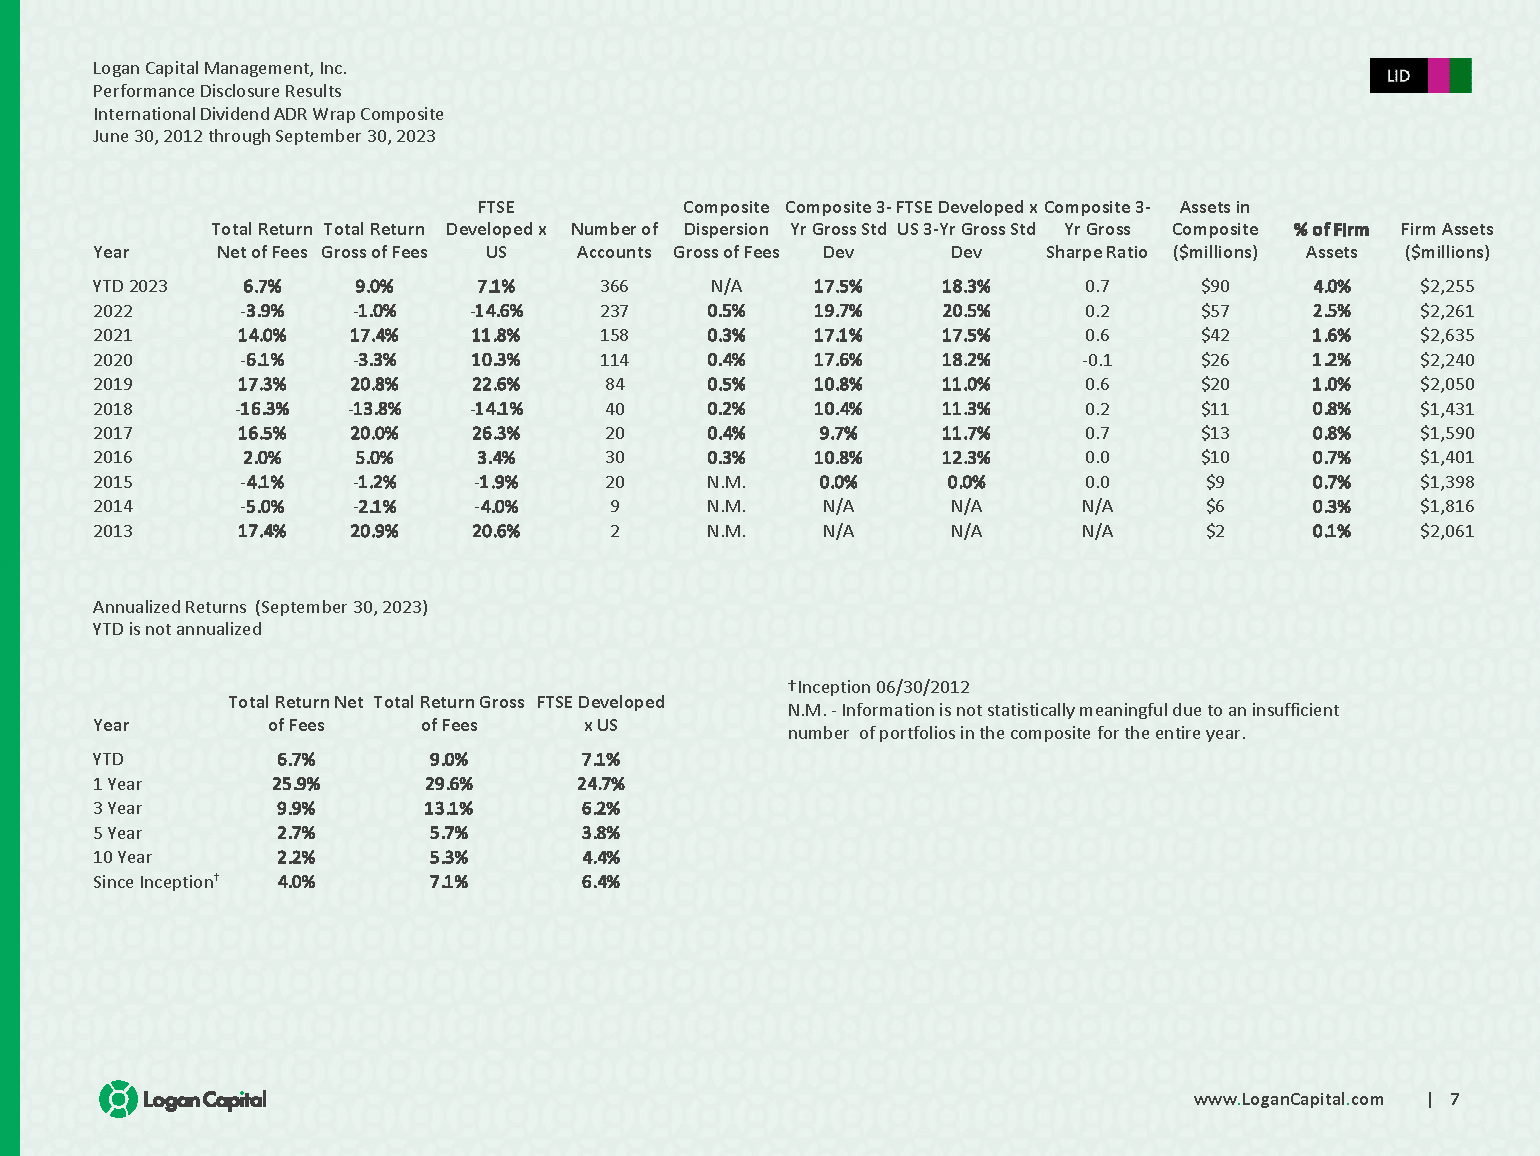
- Logan International has performed well over short and long-term periods and offers extremely competitive risk-adjusted returns versus both peers and the benchmark over all time periods.
Logan International Performance Summary:

Note: Annualized Returns Net from the Logan International Wrap Composite.
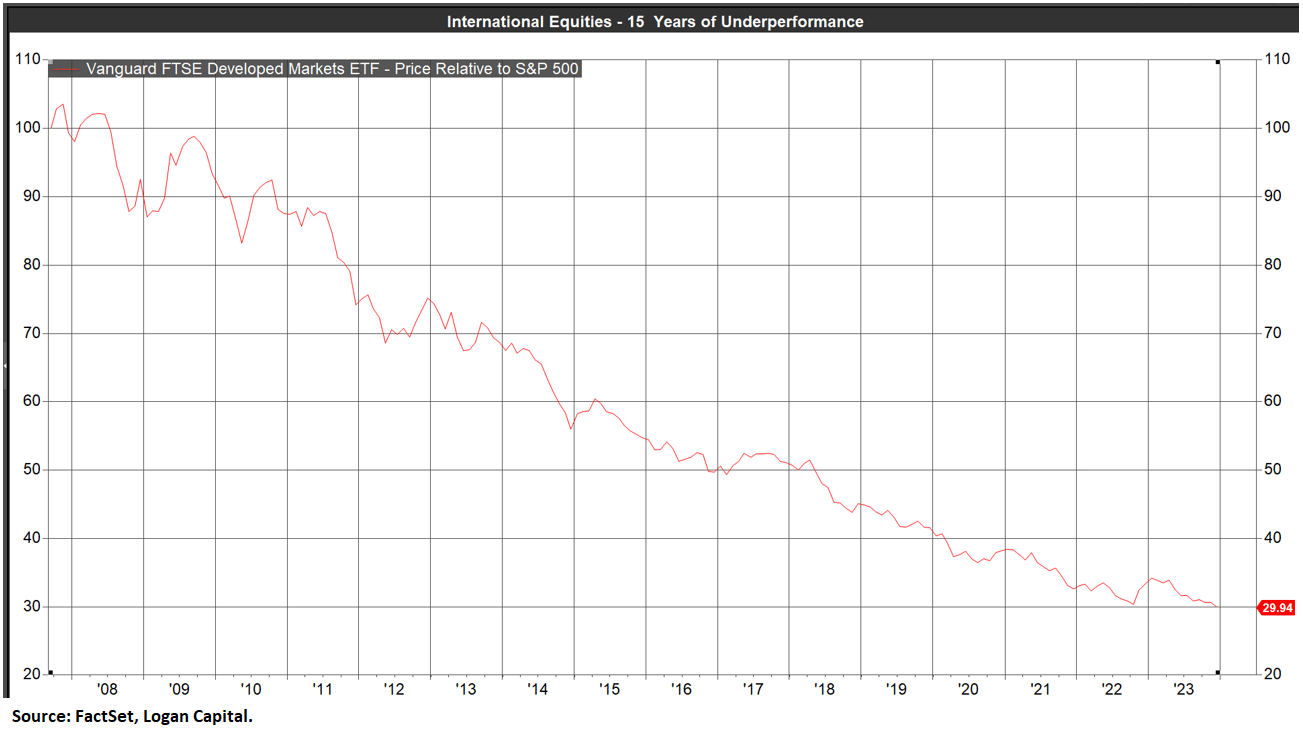
US equities have trounced international equities for fifteen years.
This chart will come as no surprise, except for perhaps the duration and magnitude of outperformance. While the chart strictly shows price movement, you are reading this correctly – an investment into international equities in late 2007 would currently be worth just 30% of an investment into the S&P 500!
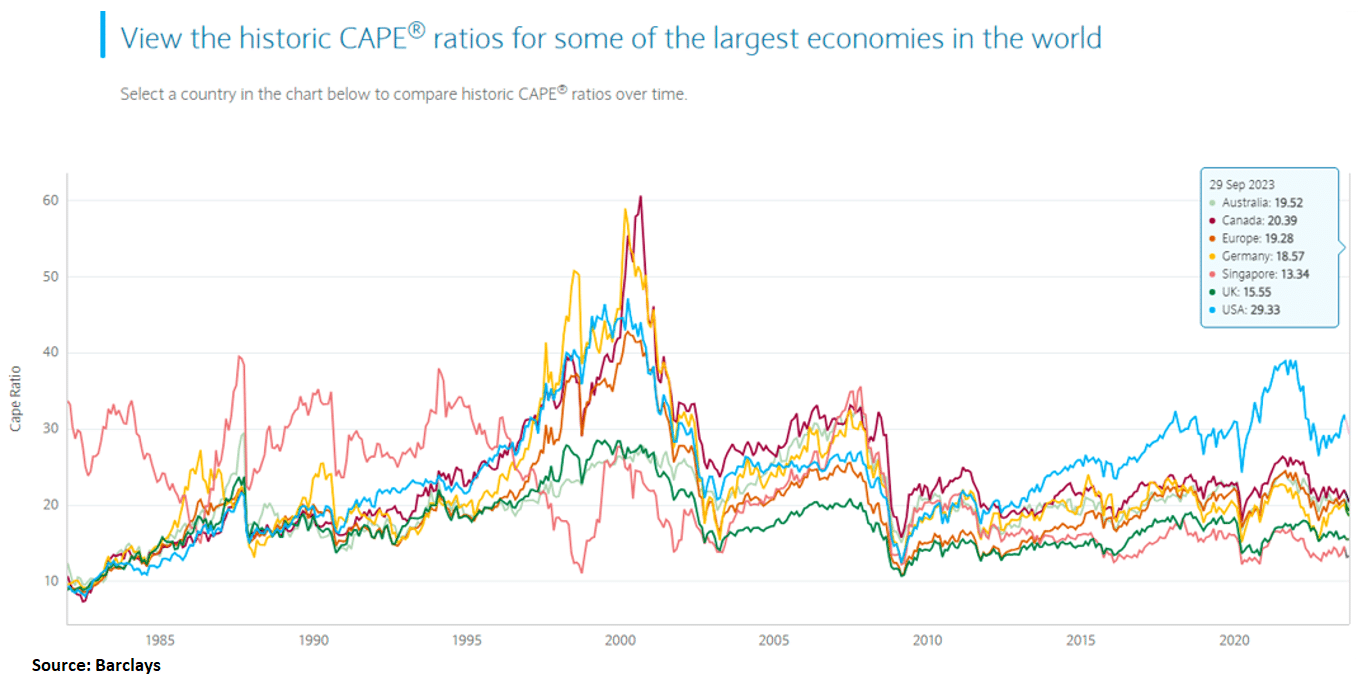
As a result, valuations now very supportive of the international equity thesis.
Regardless of valuation measure (earnings, cash flow, dividend yield, etc.) the conclusion is the same: we believe international equities offer far better value than US equities. We always prefer longer time periods to analyze financial metrics, and the CAPE ratio (Cyclically Adjusted P/E) is an effective measure of long-term financial performance. The chart below dates to the early 1980’s and illustrates that the valuation disconnect between the US and several developed market countries is very much a recent phenomenon. This refutes the notion that the US is a more sophisticated financial marketplace and always commands a premium valuation.
At Logan International, we prefer dividend yield as the preferred valuation metric and would note the contrast between US and international equities. The strategy’s primary benchmark, the FTSE Developed ex USA index, had a 3.2% dividend yield as of September 30, well above the S&P 500’s 1.7% dividend yield. Logan International had a 4.5% gross dividend yield as of September 30.
Fundamentals Now Very Supportive of International Equities… Let’s Start with Europe:
A European grocery executive whose company has a strong presence in both Europe and the US had this to say in a third quarter earnings release, “When looking at Europe, which has endured more pressure in the last two years than the U.S., I am confident we are on the path to recovery”. We’d call that an understatement and remain impressed with the resilience displayed by Europeans. The list of challenges has included an extended period of negative interest rates, the war in Ukraine alongside other global tensions, an energy crisis, heightened regulation to promote renewable energy, and of course Great Britain’s exit from the European Union. On account of the many challenges and limited top line growth, European companies have cut costs, adapted to technology changes, and now offer competitive returns against US companies. We also view Europe as a potential beneficiary of the increased tensions between the US and China and would note that the higher wages and labor tensions recently experienced in the US are nothing new to Europeans.
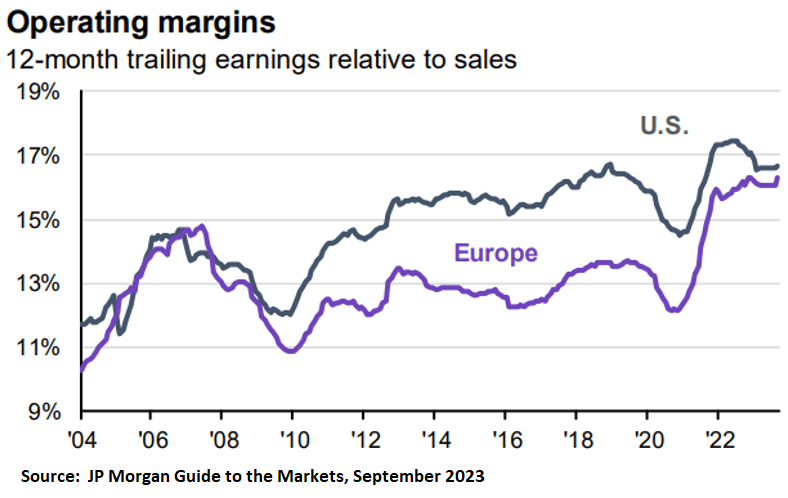
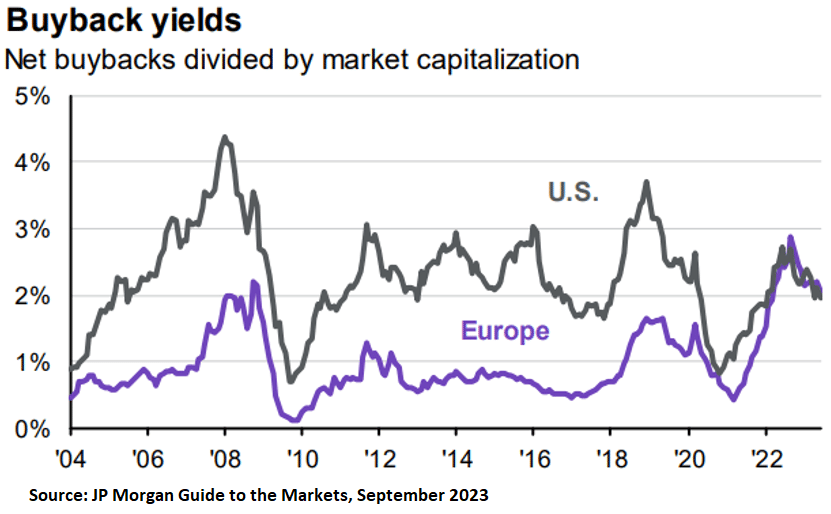
With respect to capital deployment, there’s a sense of urgency to bridge the gap between US and European companies. Shareholder activism is relatively new in Europe, and we’ve been pleased to see several Logan International holdings (especially our integrated oil companies) emphasize dividends, share repurchases, and debt reduction. On buybacks alone, Europe has now caught up to the US, as indicated below.
Japan Has Turned a Corner
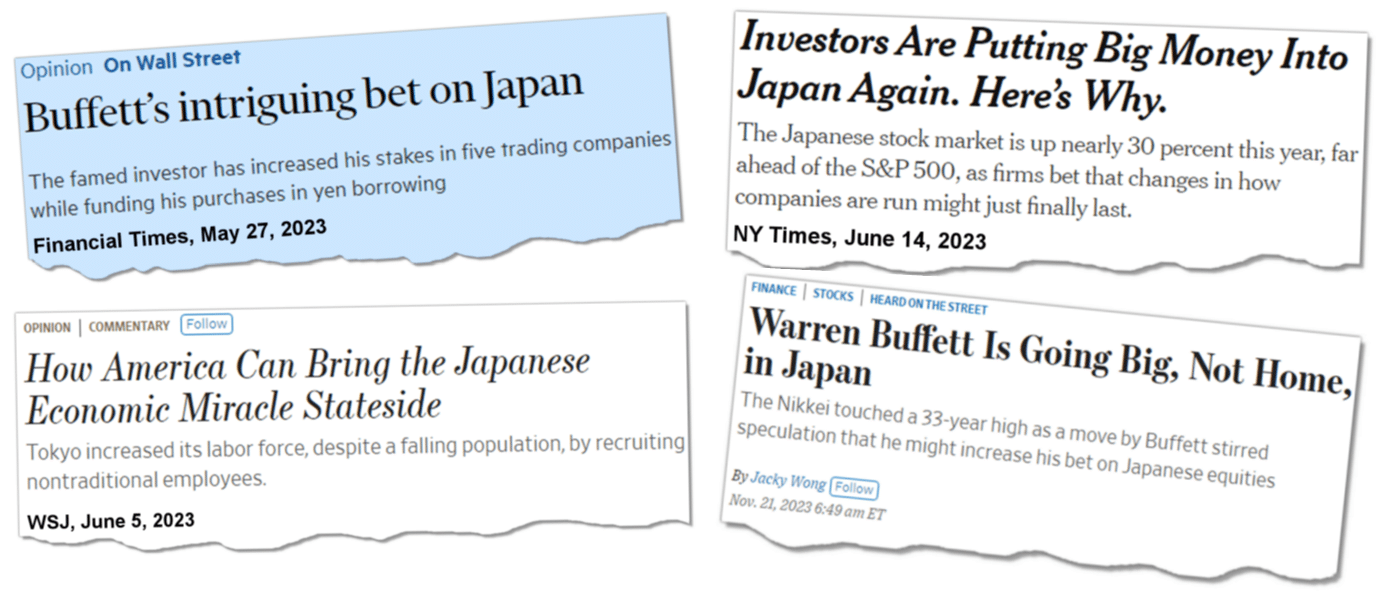
The list of challenges weighing on Japanese stocks over the last three decades is a long one, including poor demographics, poor corporate governance, and a relentless deflationary spiral, among others. However, we’ve now seen significant economic improvement on several fronts, most of which originated under former Prime Minister Shinzo Abe, whose efforts, known as “Abenomics” focused on increased government spending and corporate reforms. The weak yen and extended period of low interest rates has certainly helped, but it’s better fundamentals that most excite us. Japanese companies are much more shareholder friendly than in the past. In fact, in the fiscal year ending in March of 2023, Japanese companies repurchased a record $70 billion in company stock and paid out $100 billion in dividends, also a record. There’s likely more to come, as Japanese companies, on average, hold 25% of their assets in cash. In terms of economic growth, the BOJ is unlikely to raise short-term interest rates in the near term, so the yen may remain weak versus other currencies in the short term, providing a major tailwind for Japan’s export-heavy industrial base. As a result, industrial production is expected to rise 1.6% in Japan next year versus a decline of 0.7% in the US, according to Factset.
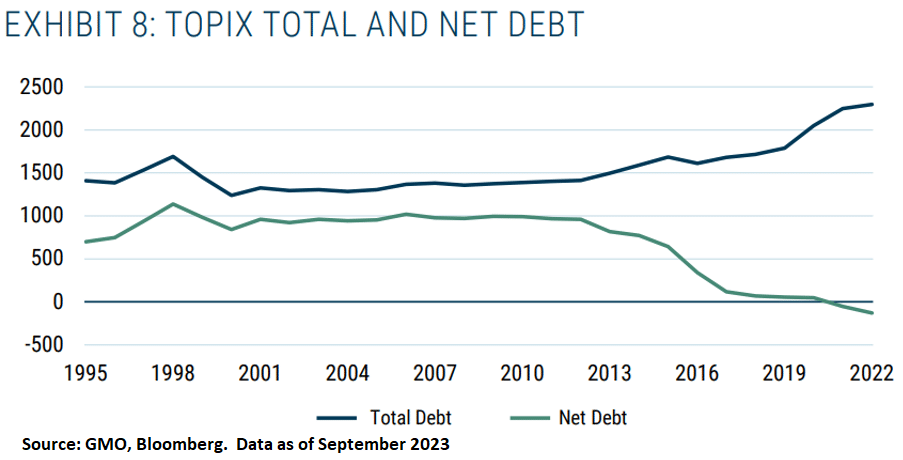
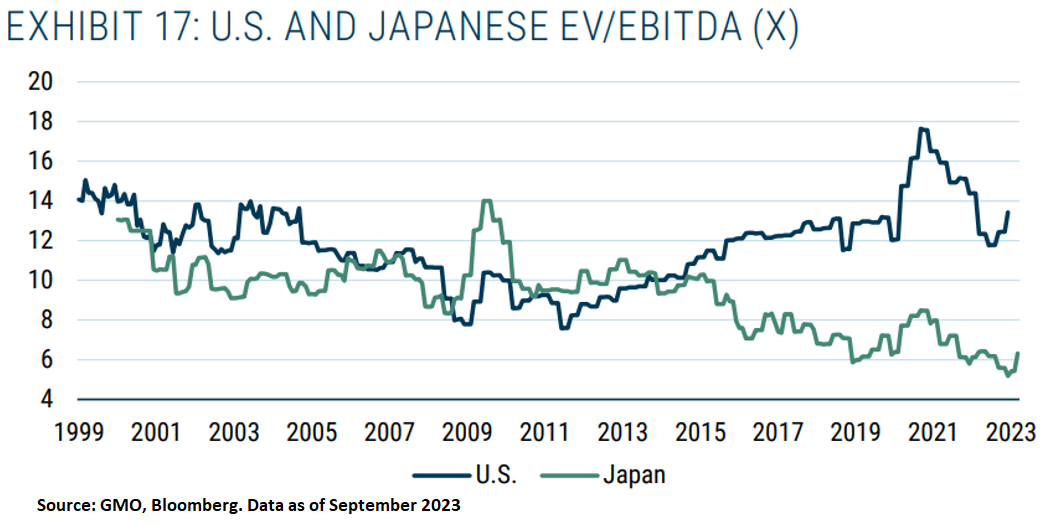
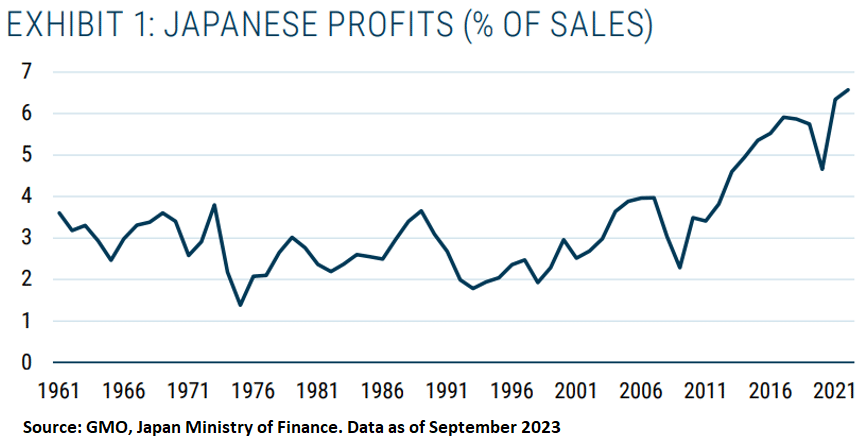
Japanese fundamentals and valuation very supportive:
1. Balance sheet strength. This wasn’t as critical in an era of central bank monetary expansion, but with stresses ahead from rising interest rates, we believe strong balance sheets provide welcome downside protection. In addition, this gives companies more financial flexibility to expand their businesses if opportunities arise.
2. Valuation supportive on all levels, especially cash flow.
3. Fundamentals improving sharply.
From a sector level, given the persistent focus on artificial intelligence, we find it most encouraging that seven of the world’s largest semiconductor manufacturers have set out plans to deepen their technology partnerships in Japan, including TSMC, Micron, Samsung, and Intel. Also, ahead of a trip to Japan in late May, IBM CEO Arvind Krishna had this to say about Japan, “There’s a much larger specialty chemicals and specialty materials capability in Japan than people realize. There’s a lot of both commercial and academic skills that lie in Tokyo”.
Sentiment has indeed improved sharply, as the headlines above indicate. The endorsement from Warren Buffett certainly doesn’t hurt. Despite excellent performance year-to-date, we continue to find good value in well-run companies such as Honda Motor, whose US-listed shares were up 37% as of November 20th yet traded at just 8x forward earnings estimates and offered a 3.7% dividend yield.
Currency Could Provide an Additional Kicker:
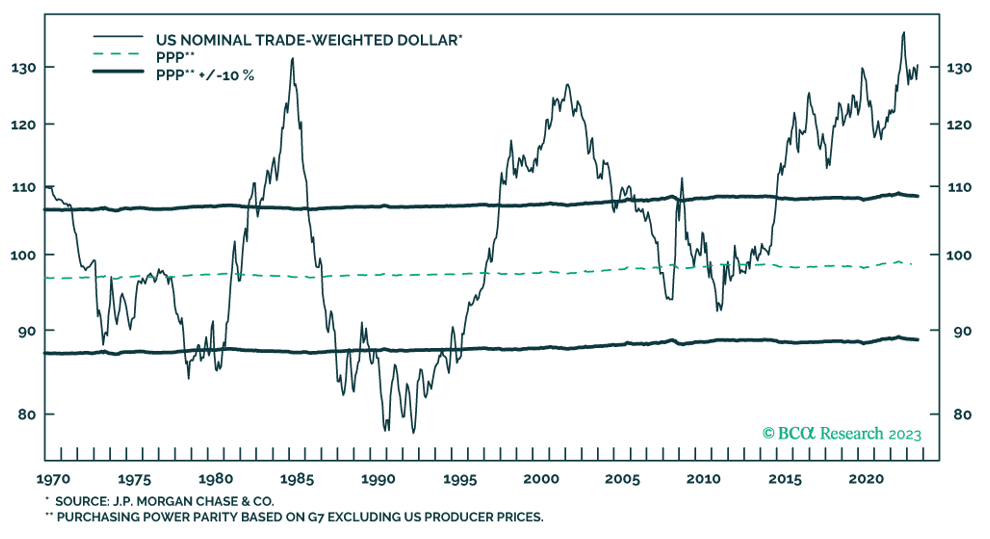
We do not hedge currency exposure at Logan International and are most exposed to the Euro, British Pound, Swiss Franc, and Japanese Yen. The US Dollar has outperformed all major currencies over the last several years, mostly due to interest rate differentials. However, the dollar rally appears long in the tooth and is significantly overvalued on a purchasing-power-parity basis, as pictured below. If foreign currencies were to rally against the dollar, this would enhance the total return potential for international investors. The primary catalyst would be if the Federal Reserve began to cut interest rates ahead of other central banks.
Company Spotlight Section: We highlight below three companies that best exemplify the Logan International investment process and philosophy. In addition to favorable valuation, these companies are allocating capital in a share-holder friendly manner, prioritizing dividends, share repurchases and debt reduction rather than acquisitions or heavy capital expenditures.
Company Spotlight – Shell:
Shell is a global integrated oil and gas company, primarily engaged in oil and gas production, refining, LNG, marketing, and chemicals. The company produces just under 3 million barrels per day. Sometimes it’s best to let the numbers do the talking. We’ll keep the math simple, as there is no reason to complicate the compelling investment thesis behind one of the world’s largest energy companies.
- According to Factset estimates, Shell is expected to generate $55 billion in cash flow from operations (CFO) this year (following $68 billion in CFO last year). Furthermore, consensus estimates call for an additional $50 billion in each of the next four years.
- What are they doing with their cash flow? Capital expenditures are expected to hover around $25 billion per annum, leaving $30 billion in discretionary cash flow. In 2022, Shell paid $8.4 billion in dividends and repurchased $18.4 billion worth of company stock (approximately 7% of outstanding shares). We view the cash flow allocation as extremely shareholder friendly, especially the stock repurchases, as shares trade at an undemanding 8x forward EPS estimates.
- Shell announced a 15% dividend increase alongside second quarter results.
- Finally, in addition to dividends and share repurchases, Shell has reduced long-term debt from $91 billion at the end of 2020 to $76 billion as March 31, 2023.
- We believe the steady stream of robust cash flows and prudent capital allocation justifies a P/E ratio well above 8x. Yet the marketplace remains unconvinced, focused on challenges to the fossil fuel industry and heavy regulatory pressure to further promote renewable energy.
- In the meantime, we get paid to wait, in the form of a competitive 3.9% dividend yield and 10.9% shareholder yield, as well as a rock-solid balance sheet that sports a net debt/ebitda ratio of just 0.8x.
Company Spotlight – Siemens:
Siemens is a German-based engineering and manufacturing company, typically referred to as an industrial conglomerate. However, following a series of asset sales and divestitures, Siemens has re-emerged as nothing short of an industrial technology heavyweight. The company is predominantly focused on areas such as digital enterprises and infrastructure, both of which have extremely attractive end markets. Siemens has been referred to as an electrical engineering giant and a meaningful play on renewable energy and electric vehicles. The fundamentals are excellent, as highlighted below:
- Sales growth outlook is favorable. The company reports in four main business units, all of whom are expected to grow sales in the mid-single digit range through at least 2025.
- The crown jewel is Digital Industries (DI), which offers comprehensive software capabilities to help companies integrate mechanical designs and electric systems to bring products to market faster and more efficiently. DI is projected to grow sales in the 8-10% range over the next three years.
- The other three main businesses (Smart Infrastructure, Mobility, and Siemens Healthineers) are each projected to grow sales in the 4-6% range through 2025.
- R&D investment has been well above peers, which bodes well for future sales growth. Siemens spent 7.8% of sales on R&D last year, more than double the average investment of their peers. They’ve made significant software investments which are already starting to bear fruit.
- Profitability numbers have improved sharply as well. From 2012 to 2018, EBITDA margins consistently hovered in the 11-13% range. However, margins increased to 14.5% in 2019 and 2020 before jumping to 17.6% in fiscal 2022.
- Valuation remains favorable despite the improved financial performance, as the marketplace still views Siemens as a low-growth industrial conglomerate. As of late November, following favorable guidance and a 6% dividend hike, shares traded at 13x 2024 EPS estimates and offered a 3.3% gross dividend yield. In addition, the company announced a new €6B share repurchase plan, which equates to an annual shareholder yield of 5.3%.
Company Spotlight – Publicis:
Publicis is a French-based communications company, essentially the third largest advertising company in the world. Their client base includes several of the world’s largest companies, such as KraftHeinz, Pfizer, Visa, Nestle, and Heineken. New clients in 2023 include Adobe, Mondelez, and Walgreens. Publicis has responded to client demand for data management and digital media, along with Direct-to-Consumer products and services. Top competitors include Omnicom, Interpublic, and WPP.
- The market continues to struggle with the advertising industry, fearing that technology has made these companies obsolete. However, Publicis’ financial performance continues to suggest otherwise. They report earnings on a semi-annual basis, and results have exceeded estimates in seven of the last eight reports, and done so by an average of 9.3%, according to Bloomberg. In addition, the share price has moved higher by an average of 3.7%, suggesting persistent skepticism in their ability to beat estimates.
- Despite 5% annual sales growth over the last five years, and expectations for mid-single-digit EPS growth through 2025, shares trade at just 11x 2024 EPS estimates and yield 4% as of mid-November. The dividend itself is well covered by company cash flows. In addition, Publicis is expected to repurchase 1.4% of outstanding shares in each of the next three years, so capital allocation remains favorable.
Logan International Performance Summary:
Logan International’s performance is solid across both short-term and long-term periods. On a 3-, 5-, and 10-year basis, the strategy has generated top quintile performance, and done so with a standard deviation in the top quartile (meaning lower than 75% of peers). The 3-year risk-adjusted performance numbers are perhaps most relevant, as they reflect a post-pandemic environment characterized by higher wages, higher interest rates, and heightened global tensions. We believe our continued focus on high dividend yielding stocks, supported by strong cash flows and robust balance sheets, will serve us well in a more challenging marketplace. In addition, investors have struggled to value high growth technology companies, as GAAP accounting doesn’t always recognize the brand loyalty and intangible assets embedded into the share prices of the Magnificent Seven growth stocks. Going forward, given the stresses from higher interest rates, good old fashioned cash flows will once again matter most, and that’s an environment we wholeheartedly welcome.
Disclosures:
This material represents an assessment of the market and economic environment at a specific point in time and is not intended to be a forecast of future events, or a guarantee of future results. Forward-looking statements are subject to certain risks and uncertainties. Actual results, performance, or achievements may differ materially from those expressed or implied. Information is based on data gathered from what we believe are reliable sources. It is not guaranteed as to accuracy, does not purport to be complete and is not intended to be used as a primary basis for investment decisions. It should also not be construed as advice meeting the particular investment needs of any investor. Past performance does not guarantee future results.
Investing internationally carries additional risks such as differences in financial reporting, currency exchange risk, as well as economic and political risk unique to the specific country. This may result in greater share price volatility. Shares, when sold, may be worth more or less than their original cost.
Indices are unmanaged and investors cannot invest directly in an index. Unless otherwise noted, performance of indices does not account for any fees, commissions or other expenses that would be incurred. Returns do not include reinvested dividends.
The FTSE Developed ex US Index is part of a range of indexes designed to help US investors benchmark their international investments. The index comprises Large (85%) and Mid (15%) cap stocks providing coverage of developed markets (24 countries) excluding the US. The index is derived from the FTSE Global Equity Index Series (GEIS), which covers 98% of the word’s investable market capitalization.
The Standard & Poor’s 500 (S&P 500) Index is a free-float weighted index that tracks the 500 most widely held stocks on the NYSE or NASDAQ and is representative of the stock market in general. It is a market value weighted index with each stock’s weight in the index proportionate to its market value.
Logan Capital pays for access to PSN portfolio analytics and receives it through Factset contract. PSN provides independent peer rankings. PSN is not related to Logan Capital.
Nothing contained herein is to be considered a solicitation, research material, an investment recommendation or advice of any kind. The information contained herein may contain information that is subject to change without notice. Any investments or strategies referenced herein do not take into account the investment objectives, financial situation or particular needs of any specific person. Product suitability must be independently determined for each individual investor. Logan Capital explicitly disclaims any responsibility for product suitability or suitability determinations related to individual investors. This information does not constitute an offer to sell or a solicitation of an offer to buy securities, nor shall there be any sale of securities, in any state or jurisdiction in which such an offer, solicitation or sale would be unlawful.
